dbt
Lineage
The dbt project's dependency graph — around the open model, for a schema, or for what a run will touch — with node details and export.
The Lineage tab draws the dbt project as a graph: sources on the left, the models built from them to the right, exposures at the end. It sits in the row of tabs under the editor whenever the active file belongs to the project. ⌘⇧L brings it up.
What the graph shows
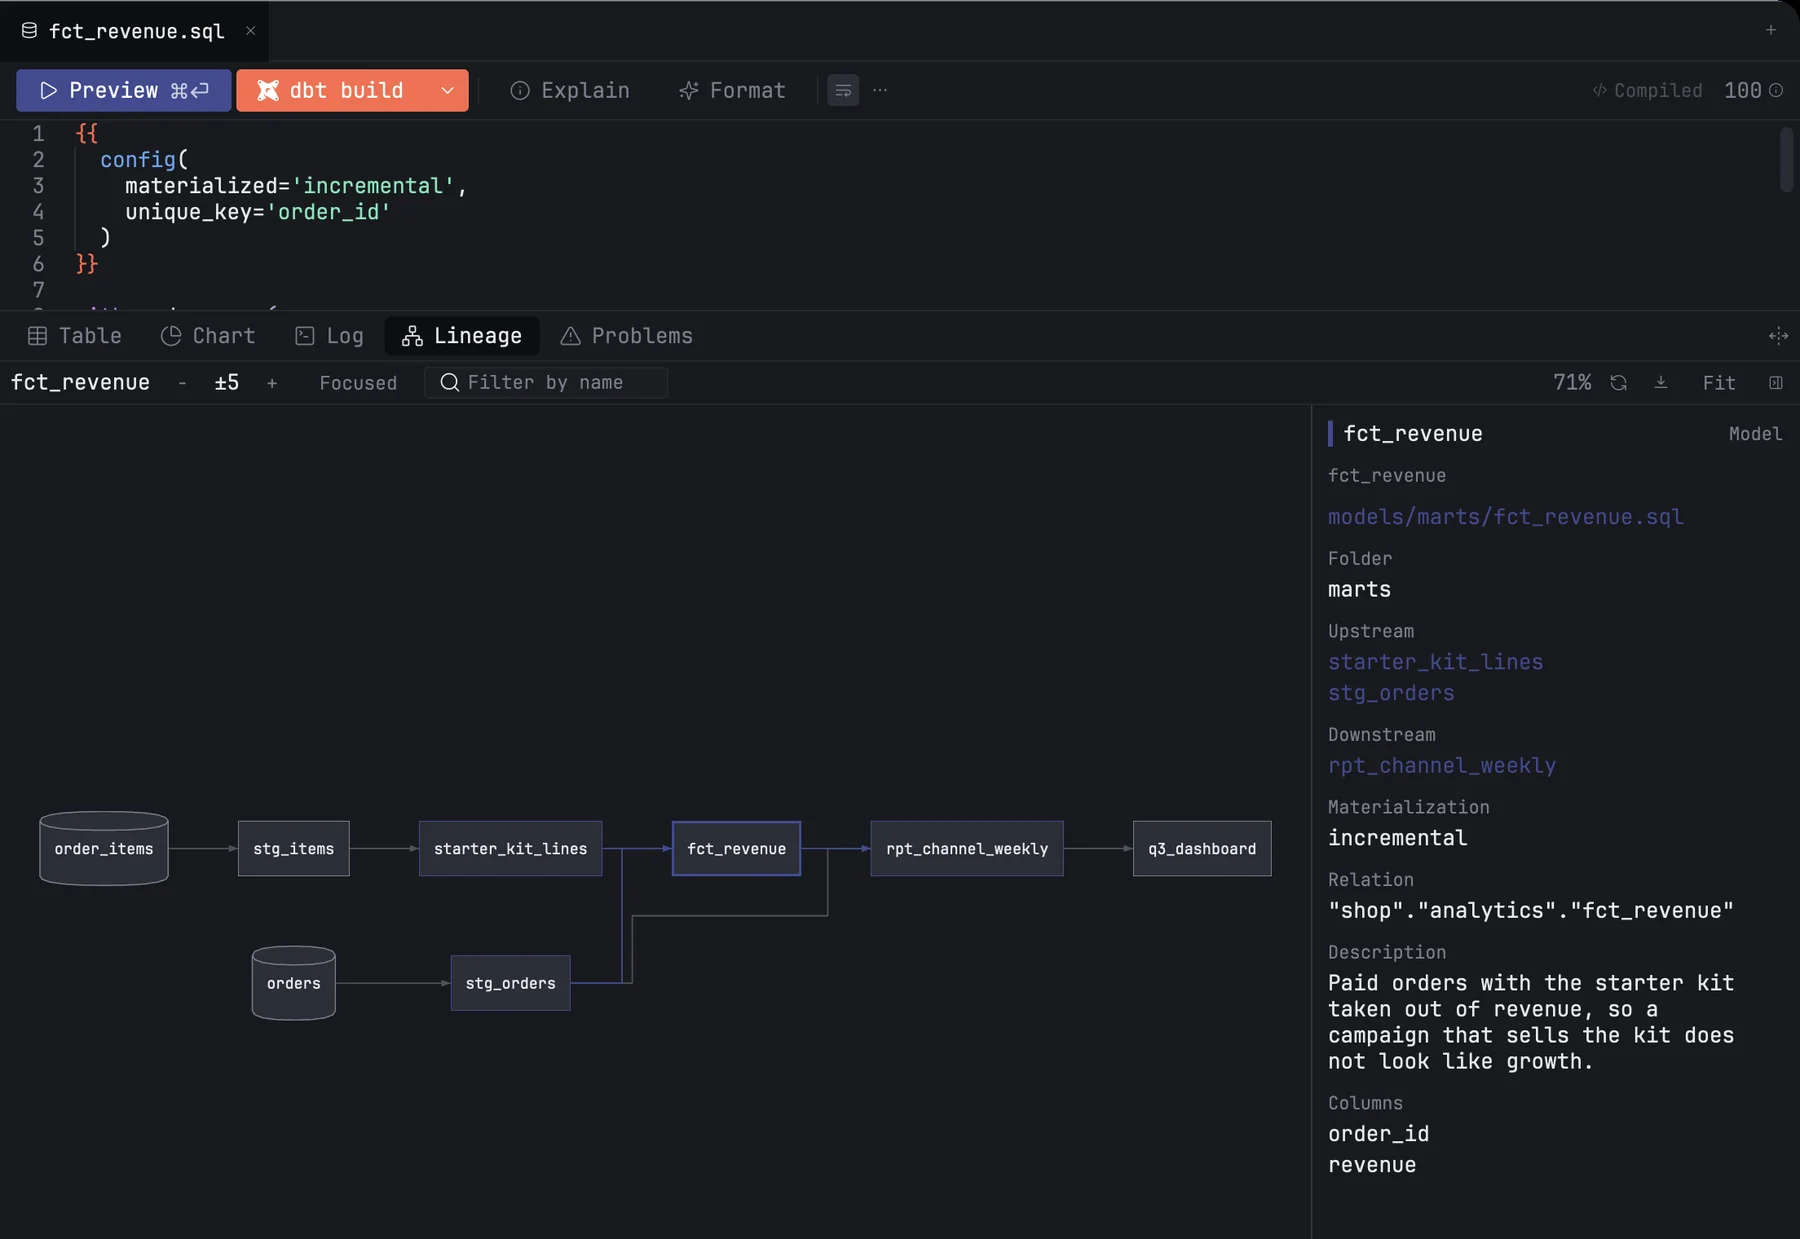
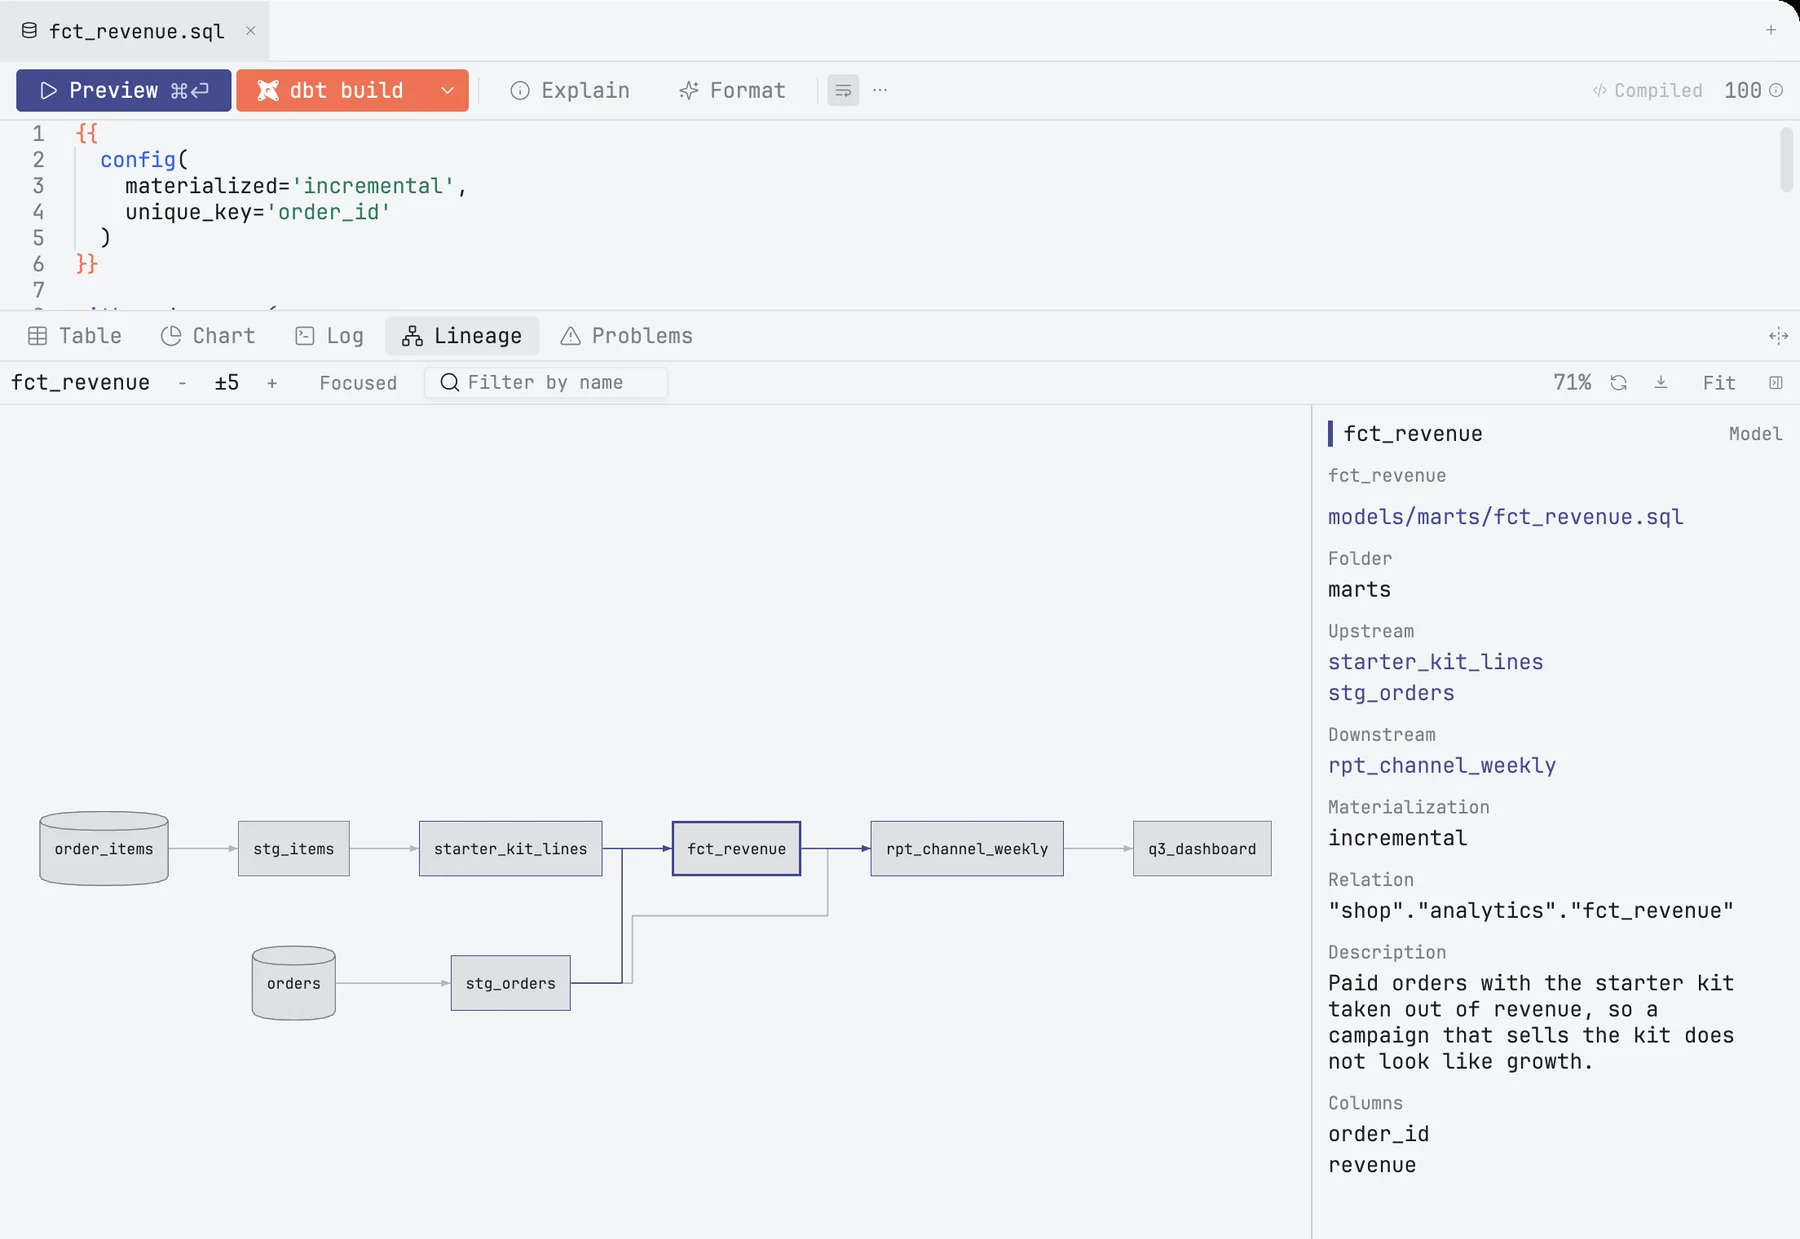
By default the graph is centred on the model open in the editor and shows everything within five steps of it, upstream and downstream. Switch tabs to another model and the graph follows. The − and + buttons in the header change the distance, from ±0 to ±8; mxds remembers your choice.
The menu next to them says which view is on screen and switches to another:
| View | Shows |
|---|---|
| Focused | the open model and its neighbours (the default) |
| Whole project | every node of the project |
| A schema | the nodes that live in one warehouse schema; the menu lists each with its count |
| Run impact | what a dbt run rewrites and everything downstream of it |
The schema list comes from manifest.json. A project that dbt has never built or parsed has none, and the menu says so. Run impact opens from Show in Lineage in the dbt build confirmation and in a pull request's review band; the nodes the run rewrites are marked. Opening a model, or pressing Space on a node, goes back to a focused view.
Sources are drawn as cylinders, everything else as boxes. Settings › dbt › Lineage sets whether the graph flows left to right or top to bottom.
Moving around
| Do | To |
|---|---|
| Scroll, or drag an empty area | pan |
| Pinch, or scroll with ⌘ held | zoom |
| Click Fit, or press F | fit the whole view in the tab |
| = / - | zoom in / out |
| Click a node | select it |
| Double-click a node, or press ↩ | centre on it and open its file |
| Space | centre on the selected node without opening it |
| ← / → | select the node upstream / downstream |
| ↑ / ↓ | select the previous / next node in the same column |
| Esc | clear the selection |
The keys work after you click the graph.
Search
Type in Filter by name to light up the nodes whose names contain the text, in any case. Everything else, and every line to it, fades. The layout does not move, so you keep your place. The filter searches inside the current view.
Moving boxes
Drag a box to put it somewhere else; its lines follow. mxds remembers where you put it, per project, in the project's .mxds folder, so the box stays there after a restart. Reset moved appears while any box has been moved and puts them back where the layout placed them.
Node details
Select a node and the panel on the right describes it:
- its name, kind and the selector dbt would use for it, such as
source:raw.orders; - its file — click to open it;
- folder and tags;
- Upstream and Downstream — click a name to select that node;
- materialization, the warehouse table it builds, its description and its columns.
The materialization, the table and the description come from manifest.json, and the panel says which are missing when dbt has not written one yet. Drag the panel's edge to make it wider. The button at the right end of the header hides or shows it.
Refreshing from dbt
The refresh button in the header runs dbt parse with your own dbt. It reads the project and rewrites target/manifest.json without connecting to the warehouse, and the graph updates when it finishes. Hover the button to see when the current manifest was made. If the parse fails, the button turns into a warning sign and its tooltip shows dbt's message.
Exporting
The download button in the header exports the whole view, including the parts that are off screen, at full size. The menu shows the size in pixels first:
- Save as SVG…
- Save as PNG…
- Copy PNG — puts the image on the clipboard.
The image uses the current theme's colours on a solid background and includes the boxes where you moved them.