SQL and results
Reading results
The results table — column summaries, sorting, filters and search, pinned columns, selecting and copying cells, pages, export and the Log tab.
The Table tab under the editor shows the result of the active query tab. Above the rows, every column has a short summary of what it holds, so you can see the shape of a result before you scroll it.
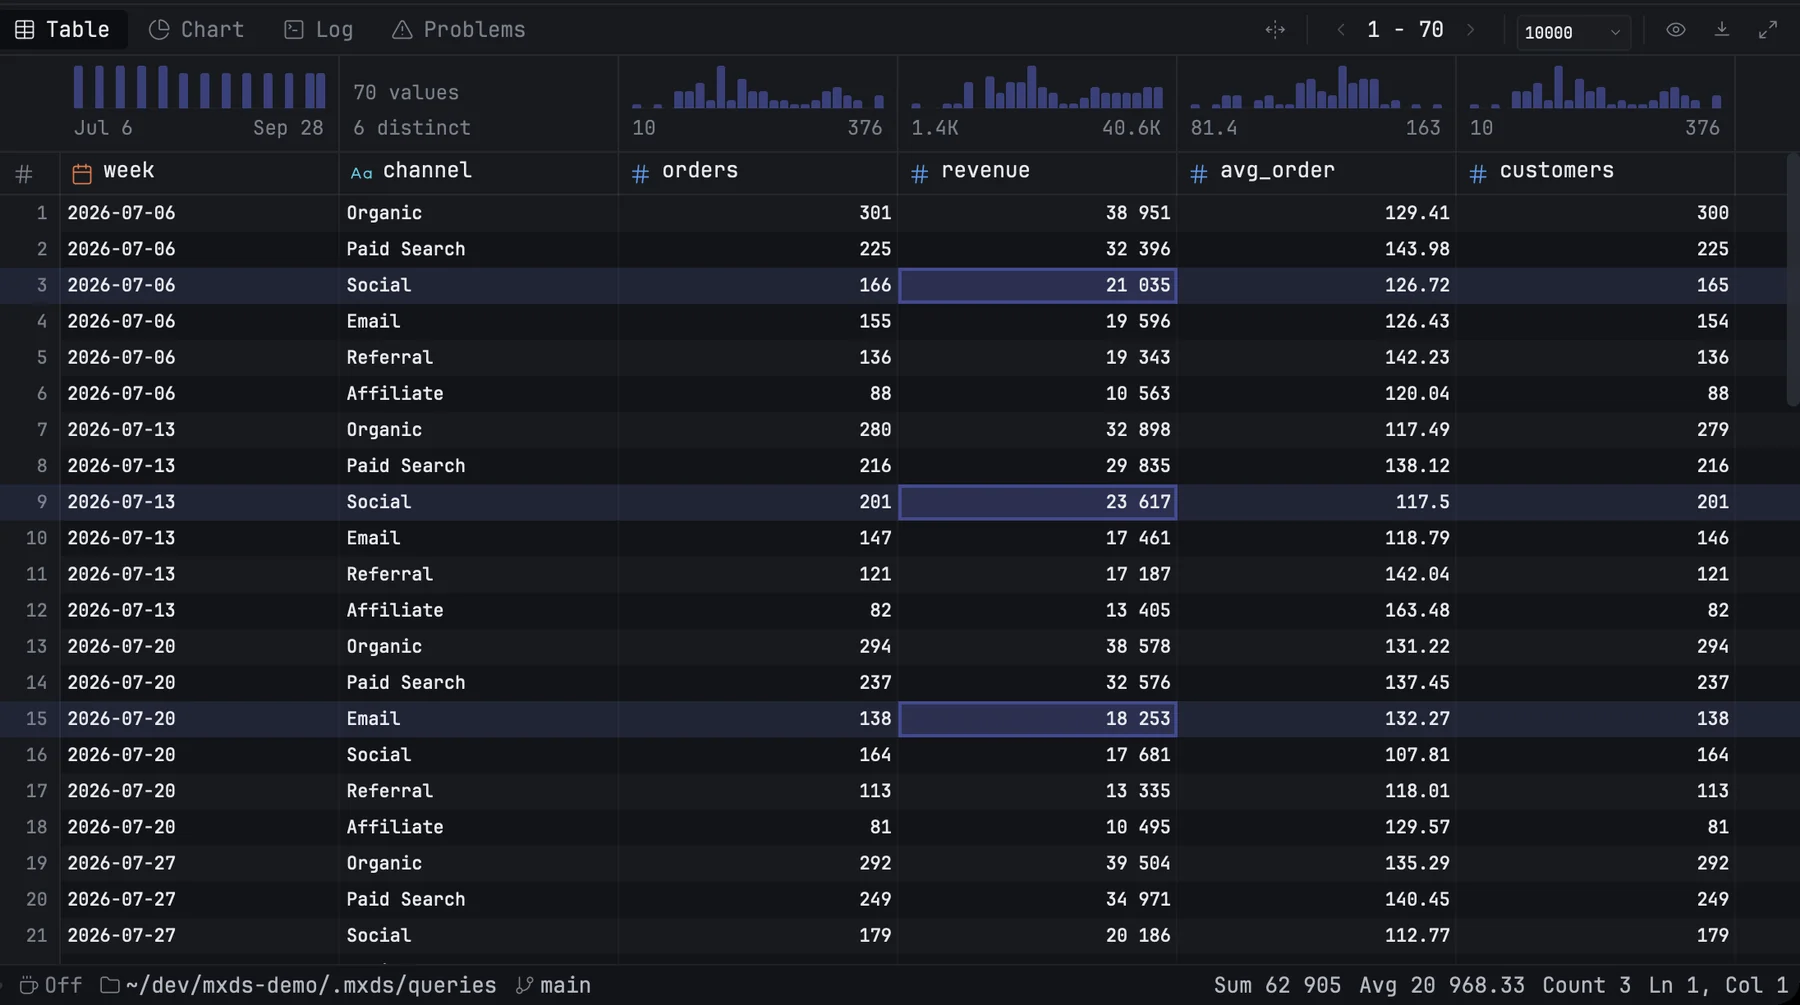
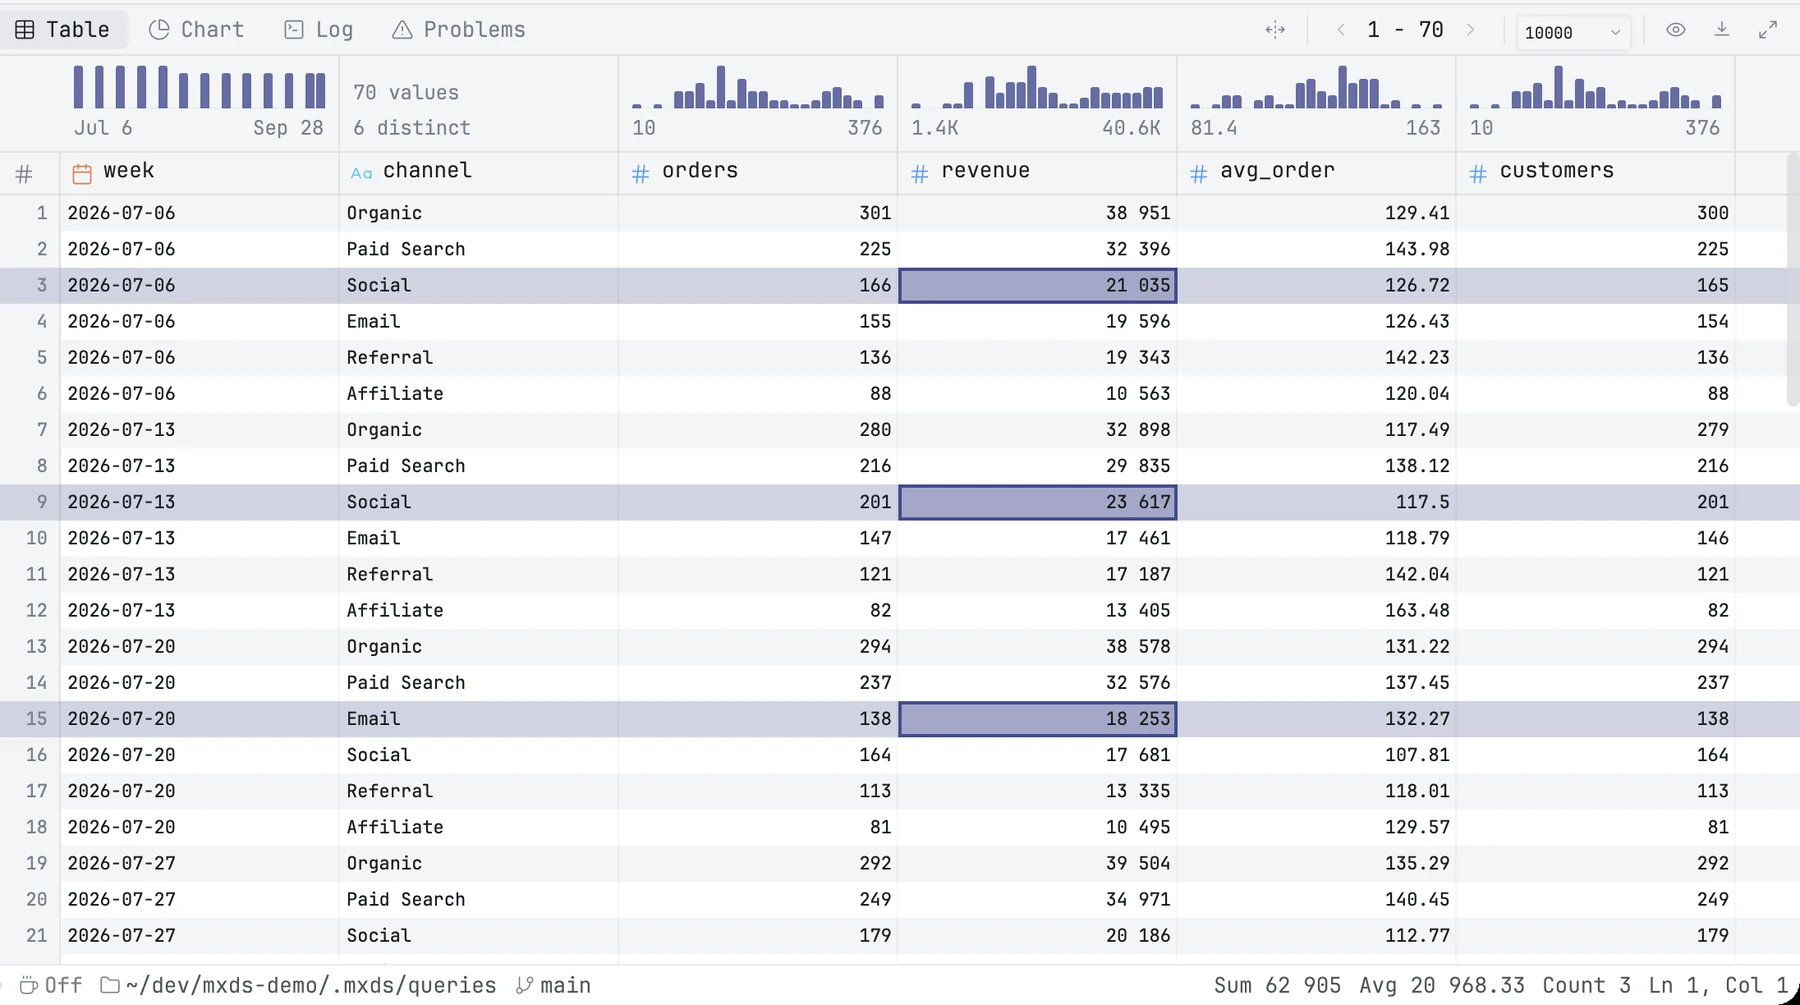
Each query tab keeps its own result, with its scroll position, selection, sort, filters and pinned columns. Running the query again replaces the result and keeps the sort, the filters, the pins and the column widths on columns of the same name; one whose column is gone is dropped.
Column summaries
The band above the rows summarizes the whole result, not just the page on screen. Every column gets a small histogram with a line under it:
| Column type | Shows |
|---|---|
| numbers | a histogram, with the minimum under its left edge and the maximum under its right edge |
| whole numbers within a range of 24, such as ratings 1–5 or days of a month | one bar per value, in order, with an empty slot for a value that is missing |
| dates and times | a histogram, with the first and last value under its edges |
| text and true/false | how many values there are, and how many of them are distinct |
Numbers are shortened to three digits, such as 74.1K or 12.5B. Dates read Jul 1 to Sep 30 within one year, Dec 2025 to Jan 2026 across years, and as times within one day. When a column has NULLs, their count sits on the same line between the minimum and the maximum, in orange; in a narrow column it shrinks to a dot. Hover over a column's summary for the exact minimum and maximum, the average and the share of NULLs.
A narrow column draws fewer, wider bars: neighbouring bars are added together, so the histogram still covers every value. In a one-bar-per-value histogram whose values lie within 24 of each other, a number missing from the data is an empty slot, so 1, 2, 5 shows two gaps before 5.
When a filter is on, the summaries describe the filtered rows. The eye button at the right of the results toolbar hides or shows the band.
How values look
Numbers are aligned right and grouped in thousands. Settings → Appearance → Data Table sets:
- Number style — such as
1 234.56,1,234.56or1.234,56. - Decimal places — automatic, or a fixed 0 to 6.
- Empty values —
NULLor—. A realNULLis drawn dimmed; a text value that happens to readNULLis shown as ordinary text.
Integer columns whose names look like ids, years, codes, zip codes or phone numbers, such as customer_id or year, are not grouped. Formatting changes only how values look: copying, search and export use the actual value. Dates are shown as the database returns them.
Hover a cell whose text is cut off to read all of it.
Data bars
Hover the header of a number column and click the bar icon to draw a bar in each cell, scaled to the column's range. Negative values are drawn in red. Click the icon again to remove the bars; running the query again also removes them.
Sorting
Click a column header to sort by it: once for ascending, again for descending, a third time to go back to the result's own order. The whole result is sorted, not only the rows on screen, and every page follows the sort. Sorting by another column replaces the sort.
Filtering
Hover a header and click the funnel icon, or right-click the header, to filter the column by its values. The list shows each value with how many rows have it; type in Search… to narrow it, tick the values you want and click Apply.
- Filters on several columns combine: a row must pass all of them.
- A filtered column has a
*in its header. - Reset Filters removes the filters on every column.
- The status bar and the column summaries count the filtered rows.
Searching
⌘F searches the cells of the current page. Matches are highlighted rather than filtered, and the counter shows which one you are on.
| Key | Does |
|---|---|
| ↩ | next match |
| ⇧↩ | previous match |
| Esc | close the search |
Search ignores case unless you turn on Match case. Regular expression and Match entire cell value are next to it.
Pinned columns
Hover a header and click the pin to keep the column at the left while you scroll sideways. Pinned columns stay in the order you pinned them; click the pin again to unpin. Pins stay when you run the same query again, and copy and export use the pinned order.
Column width
Drag the edge of a header to resize a column, or double-click the edge to fit it to its values. Widths are kept for the same column names when you run the query again.
Selecting cells
Click a cell to select it, ⇧-click or drag to select a range, and ⌘-click to add or remove single cells. ⌘A selects every cell on the page; Esc clears the selection.
Arrow keys move the selection and ⇧ with an arrow extends it. ⌘ with an arrow jumps to the first or last row or column.
Sum, average and count
Select two or more cells and the status bar shows their sum, average and count. They cover every selected row, including rows you have not scrolled to; while a large selection is being added up, every measure but the count shows …. The status bar follows the active tab: switch to another tab and it shows that tab's selection, or none. Right-click those numbers to choose which measures appear: sum, average, median, min, max, range, standard deviation, count, count of numbers, and count of distinct values. Your choice is remembered. Click a number to copy it, unrounded.
Sums and averages use number columns only; digits stored as text are not added up. A selection of more than 100,000 cells that is not one rectangle, such as one built with ⌘-click, shows only the count.
With nothing selected, the status bar shows how many rows and columns the result has and how long the query took.
Copying
| Keys | Copies |
|---|---|
| ⌘C | the selected cells as comma-separated values |
| ⌘⇧C | the same, with a first line of column names |
Every selected row is copied, including rows you have not scrolled to. Values are copied as they are stored, without number formatting, and an empty value as NULL.
Pages
A result is shown a page at a time, 10,000 rows by default. The controls at the bottom right move between pages and show which rows you are on; the menu next to them sets the page size: 100, 10,000, 50,000, 1,000,000 or all rows. When the results pane is narrow, the page controls are hidden.
Exporting
Export in the results toolbar saves the result as CSV, TSV, JSON, SQL insert statements, Parquet or Excel. For a result of more than one page, choose between all rows and the current page. The file follows the table's filters, sort and pinned columns. After it is written, Show in Finder opens its folder.
Zoom next to Export enlarges the results over the rest of the layout; click it again to go back. ⌘J hides or shows the results.
The Log tab
The Log tab lists what the tab has done, one line per event, with the time:
- each query that started, with its connection and the start of its SQL;
- how it ended: the number of rows and the time, the number of rows a change affected, OK, an error, or a cancellation;
- dbt runs started from the tab.
A statement that changes data and returns no rows opens the Log tab by itself. Copy log copies the whole log as text and Clear empties it. The log keeps the most recent 500 entries.