Workspace
Usage dashboard
A one-screen summary of the queries you and your agents ran, how they went, and when you work.
The usage dashboard shows how you use mxds: how many queries you and your agents ran, how many failed, how long they took, and when in the day you work. Open it with ⌘⇧I, the chart button in the rail above Settings, or File → Usage Analytics.
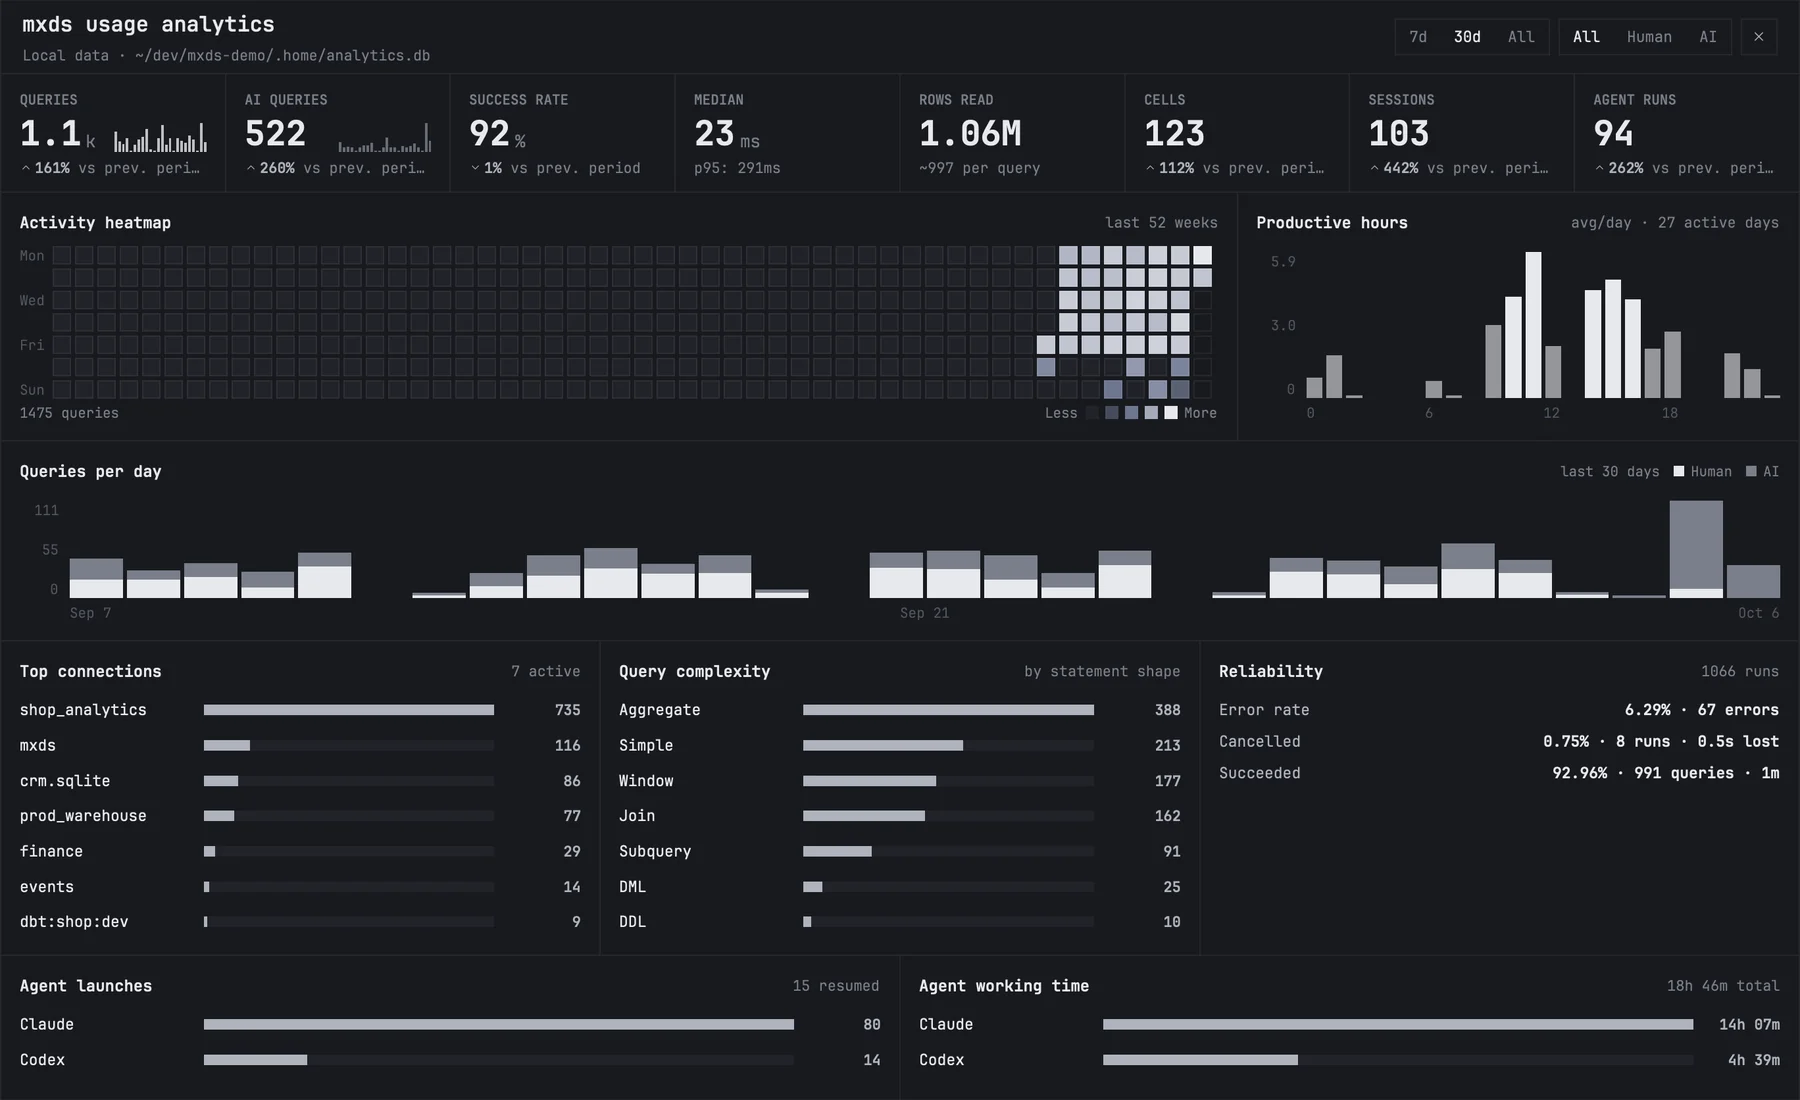
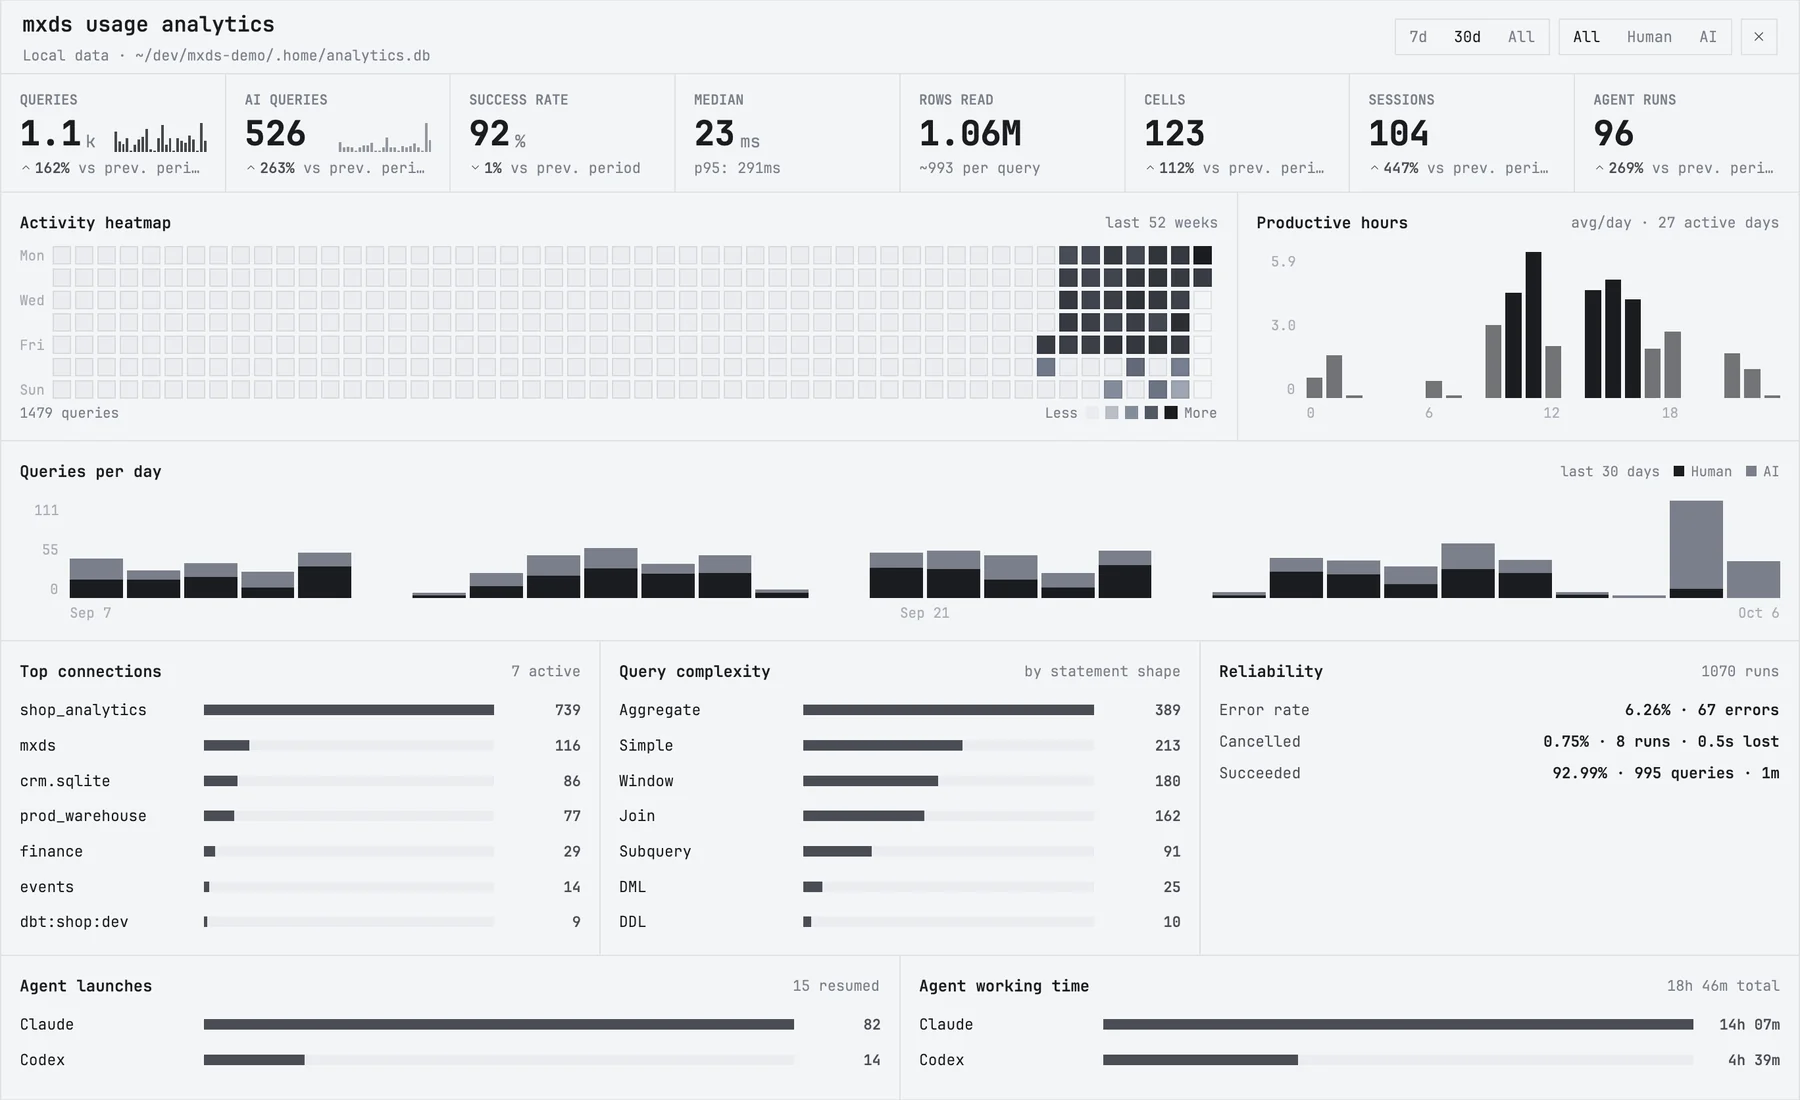
It opens over the window. Close it with Esc, ⌘⇧I again, the ✕ in its corner, or a click outside it.
Choosing what to count
Two switches in the header:
- 7d, 30d, All — the time range.
- All, Human, AI — whose queries. Human is what you ran from the editor and notebooks; AI is what agents ran through the
mxdscommand or MCP.
The numbers
The row of numbers at the top covers the chosen range. Under most of them, an arrow compares with the period of the same length just before it; All has no earlier period, so it shows none.
| Number | Counts |
|---|---|
| Queries | every query the switches select |
| AI queries | the ones agents ran |
| Success rate | the share that finished: neither failed nor cancelled |
| Median | the typical query duration; under it, p95 — the time 95 % of queries stay within |
| Rows read | rows returned, with the average per query |
| Cells | notebook cells you ran |
| Sessions | times you started mxds |
| Agent runs | agent sessions started in mxds terminals |
The small line under Queries and AI queries is their day-by-day trend. With Human selected, AI queries is hidden; with AI, Queries is.
The cards
| Card | Shows |
|---|---|
| Activity heatmap | one square per day for the last 52 weeks; the stronger the colour, the more queries |
| Productive hours | average queries per hour of the day, over the days you were active |
| Queries per day | a bar per day, split into human and AI |
| Top connections | the connections you queried most; the built-in database is listed as mxds |
| Query complexity | queries by shape: simple, join, aggregate, subquery, window, DDL (create, alter, drop) and DML (insert, update, delete, merge) |
| Reliability | errors, cancelled queries and the time they used, and successful queries |
| Agent launches | how many times each agent was started, and how many of those were resumed from a past chat |
| Agent working time | how long each agent was busy working |
Where the data comes from
Everything on the dashboard is read from a file on your Mac, ~/.mxds/analytics.db; the dashboard's header names the file it is reading. The file never leaves your Mac. It covers every project, not only the one that is open.
To stop recording, turn off Settings → Help → Privacy → Collect usage analytics. What is already recorded stays and the dashboard keeps showing it; new queries are not added.